Watch out: this post is 6 years old.
I’d like to introduce you to a technique I’ve found really useful for product development, as well as real-life stuff.
It’s called Monte Carlo analysis, and it helps you explore and deeply understand formulas and metrics by combiniting distributions, rather than simple scalar numbers.
To set up the technique, let’s look at a really simple question from my Twitter days: how many Tweets are on screen at any time in TweetDeck?
I wanted to know this to do some performance work, but there could be reasons related to showing ads or to answer a design question about information density.
Let’s make some assumptions to start with:
- The “medium” column width in TweetDeck is 310px wide, and is the default
- The average screen is 1100x1600px (let’s say we Google for research on this)
- The average Tweet height within TweetDeck is 230px
Based on this, we can say:
- With columns of 310px and a screen width of 1600px, we’d expect 5 columns to fill the screen
- With Tweets of 230px and a screen height of 1100px, we’d expect to fit about 5 Tweets vertically
- With 5 columns and 5 Tweets per column, we’d expect to fit 25 Tweets on the screen
Job done? Maybe not.
The trouble is, there are some big assumptions here: screen sizes vary hugely, of course, but also Tweets can have hugely varied heights because of different types of media.
Additionally, column-width is configurable from a slim 210px up to a positively width-y 350px.
So we’ve got a big margin of error here.
If, for example we choose a bigger screen of 2560x1440px, a slimmer TweetDeck column setup and some text-only columns with shorter Tweets:
- With columns of 210px and a screen width of 2560px, we’d expect a whopping 12 columns
- With Tweets of 100px and a screen height of 1440px, we’d expect to fit a fulsome 14 Tweets vertically
- With 12 columns and 14 Tweets per column, we’d find a brobdingnagian 168 Tweets on the screen
How do we account for this? (By the way: let’s assume we can’t actually just measure this stuff, for the sake of example. Even though we could.)
Monte Carlo analysis is a technique that uses:
repeated random sampling to obtain numerical results. The underlying concept is to use randomness to solve problems that might be deterministic in principle.
The idea is simple:
- instead of single numbers, generate a distribution to represent the variable
- combine the distributions as you would the single numbers, but randomly sample from each input distribution to produce an output distribution
- recombine output distributions to produce a final result
So, for our example above, we can define some distributions:
- Column widths in TweetDeck are either 210px, 310px or 350px wide
- Screen sizes are between 1080x768px and 2560x1440px, and are normally distributed within this range
- Tweet heights are between 66px and 400px, and are log-normally distributed (so there are more on the left-hand end of the range)
We can then randomly sample from each to produce an output. But this is the tricky bit: randomly sampling by hand is pretty laborious.
To help, I’d like to introduce you to a tool called Guesstimate. It describes itself as a “spreadsheet for things that aren’t certain,” and I love it.
It does the sampling for you and has a really intuitive way of managing distributions.
Here’s a screenshot from an example that models our Tweets-on-screen question:
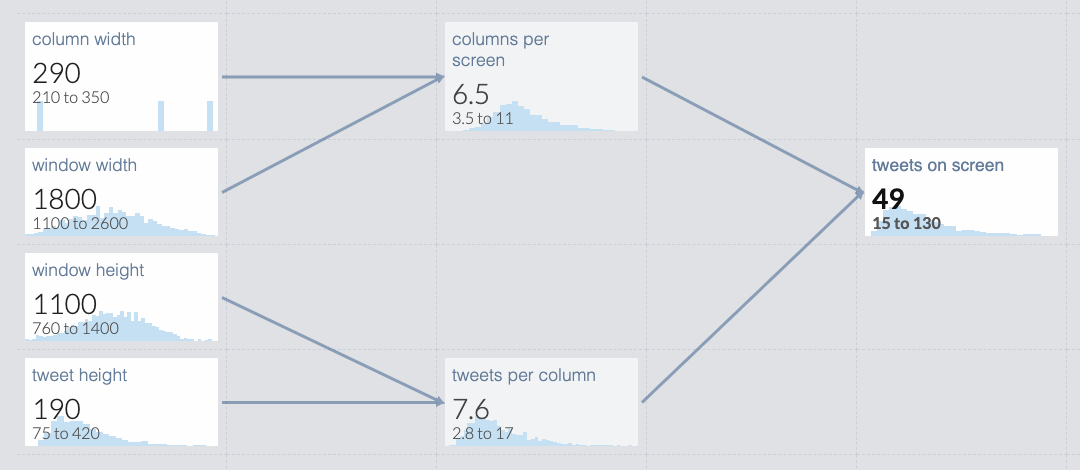
We have all the inputs modelled on the left, intermediary results in the middle, and the result on the right. It works like a spreadsheet: each cell contains a distribution, or a formula that combines input distributions (or single numbers). The arrows are showing how data flows through the model.
As you can see, it’s saying that we’d expect around 50 Tweets on screen, on average, but that also that there’s a right-skewed distribution of counts between 15 and 130:
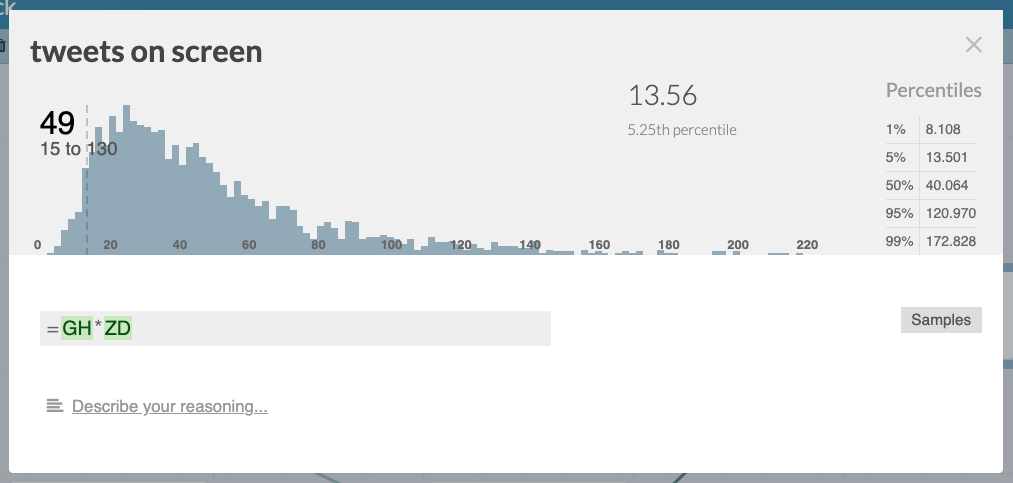
This has given us a much more nuanced view of the situation: we need to account for a small number of Tweets on screen in most cases, but there will some small number of cases that can reach over 200.
This is useful for corner-case testing: we can see easily see the extreme or pathological cases we need to worry about.
There’s a range of public models to peruse on Guesstimate, showing some of the power available.
For example, Adrian Crockfort modelled the expected response times for a storage service with a caching layer:
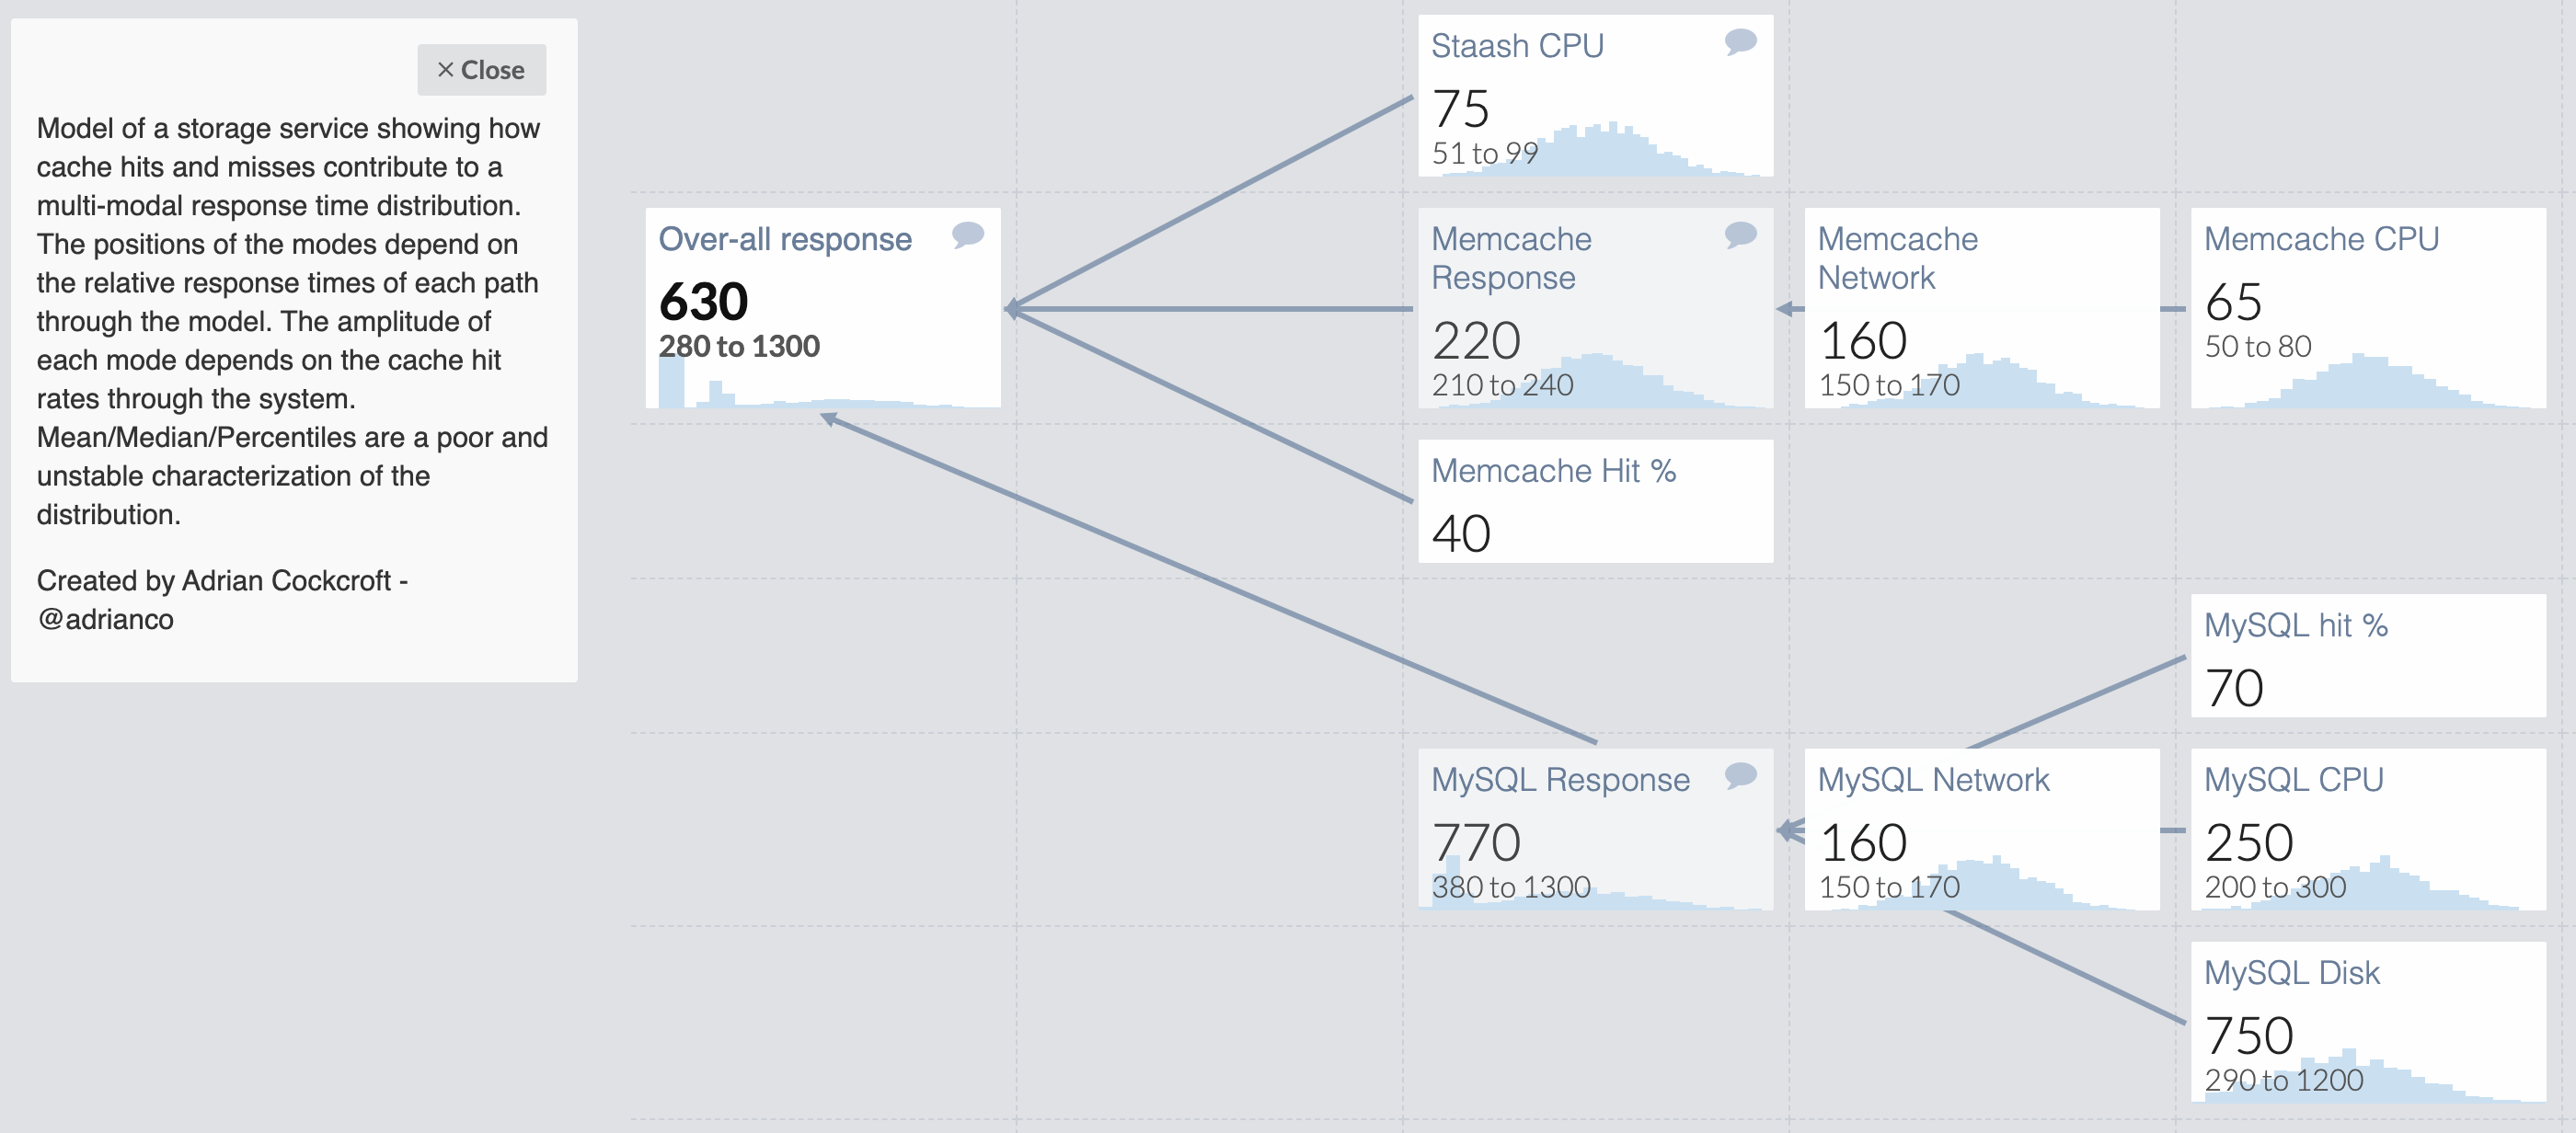
He’s even used one of Guesstimates other functions — randomInt — to model the chance of a cache hit or miss, too:
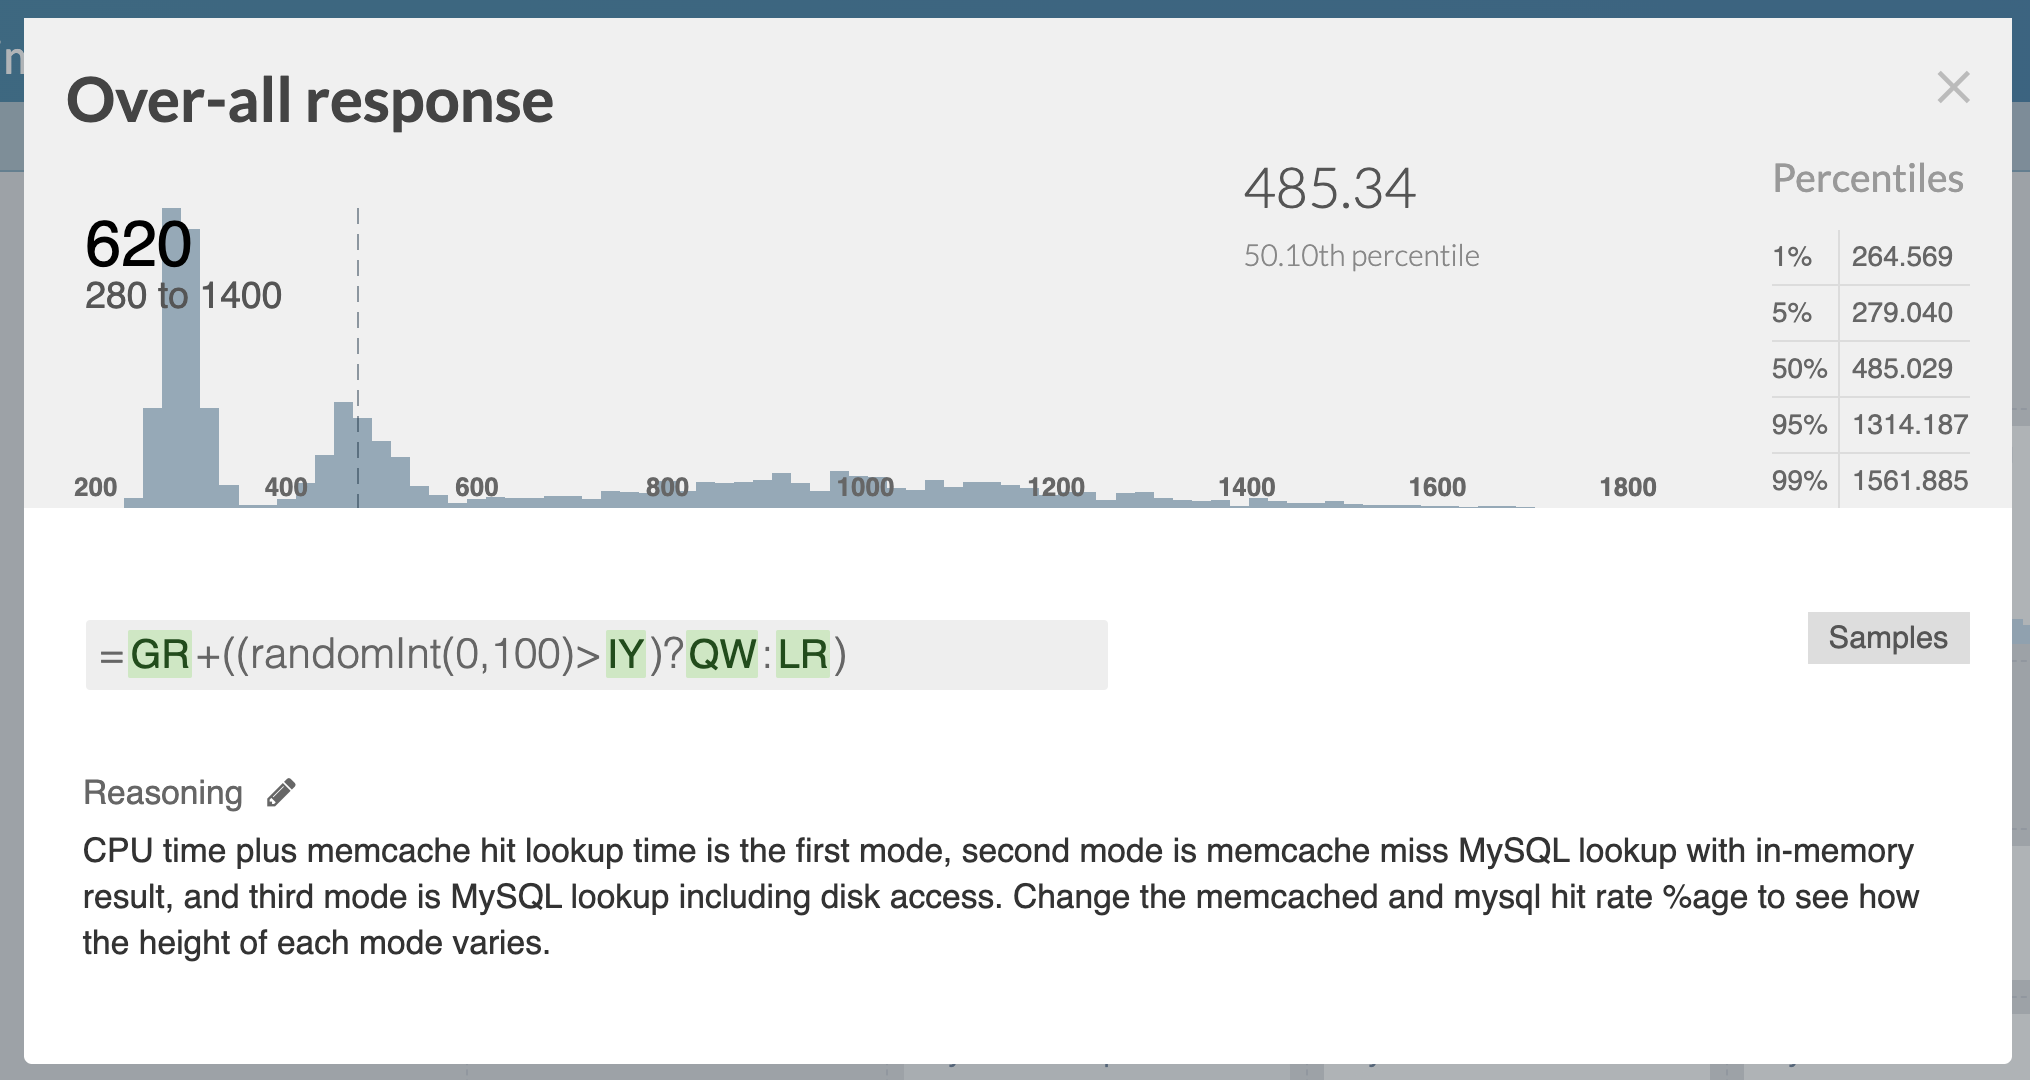
That’s why you can see several peaks in the distribution: there are sampling choices being made for each entry in the output distribution.
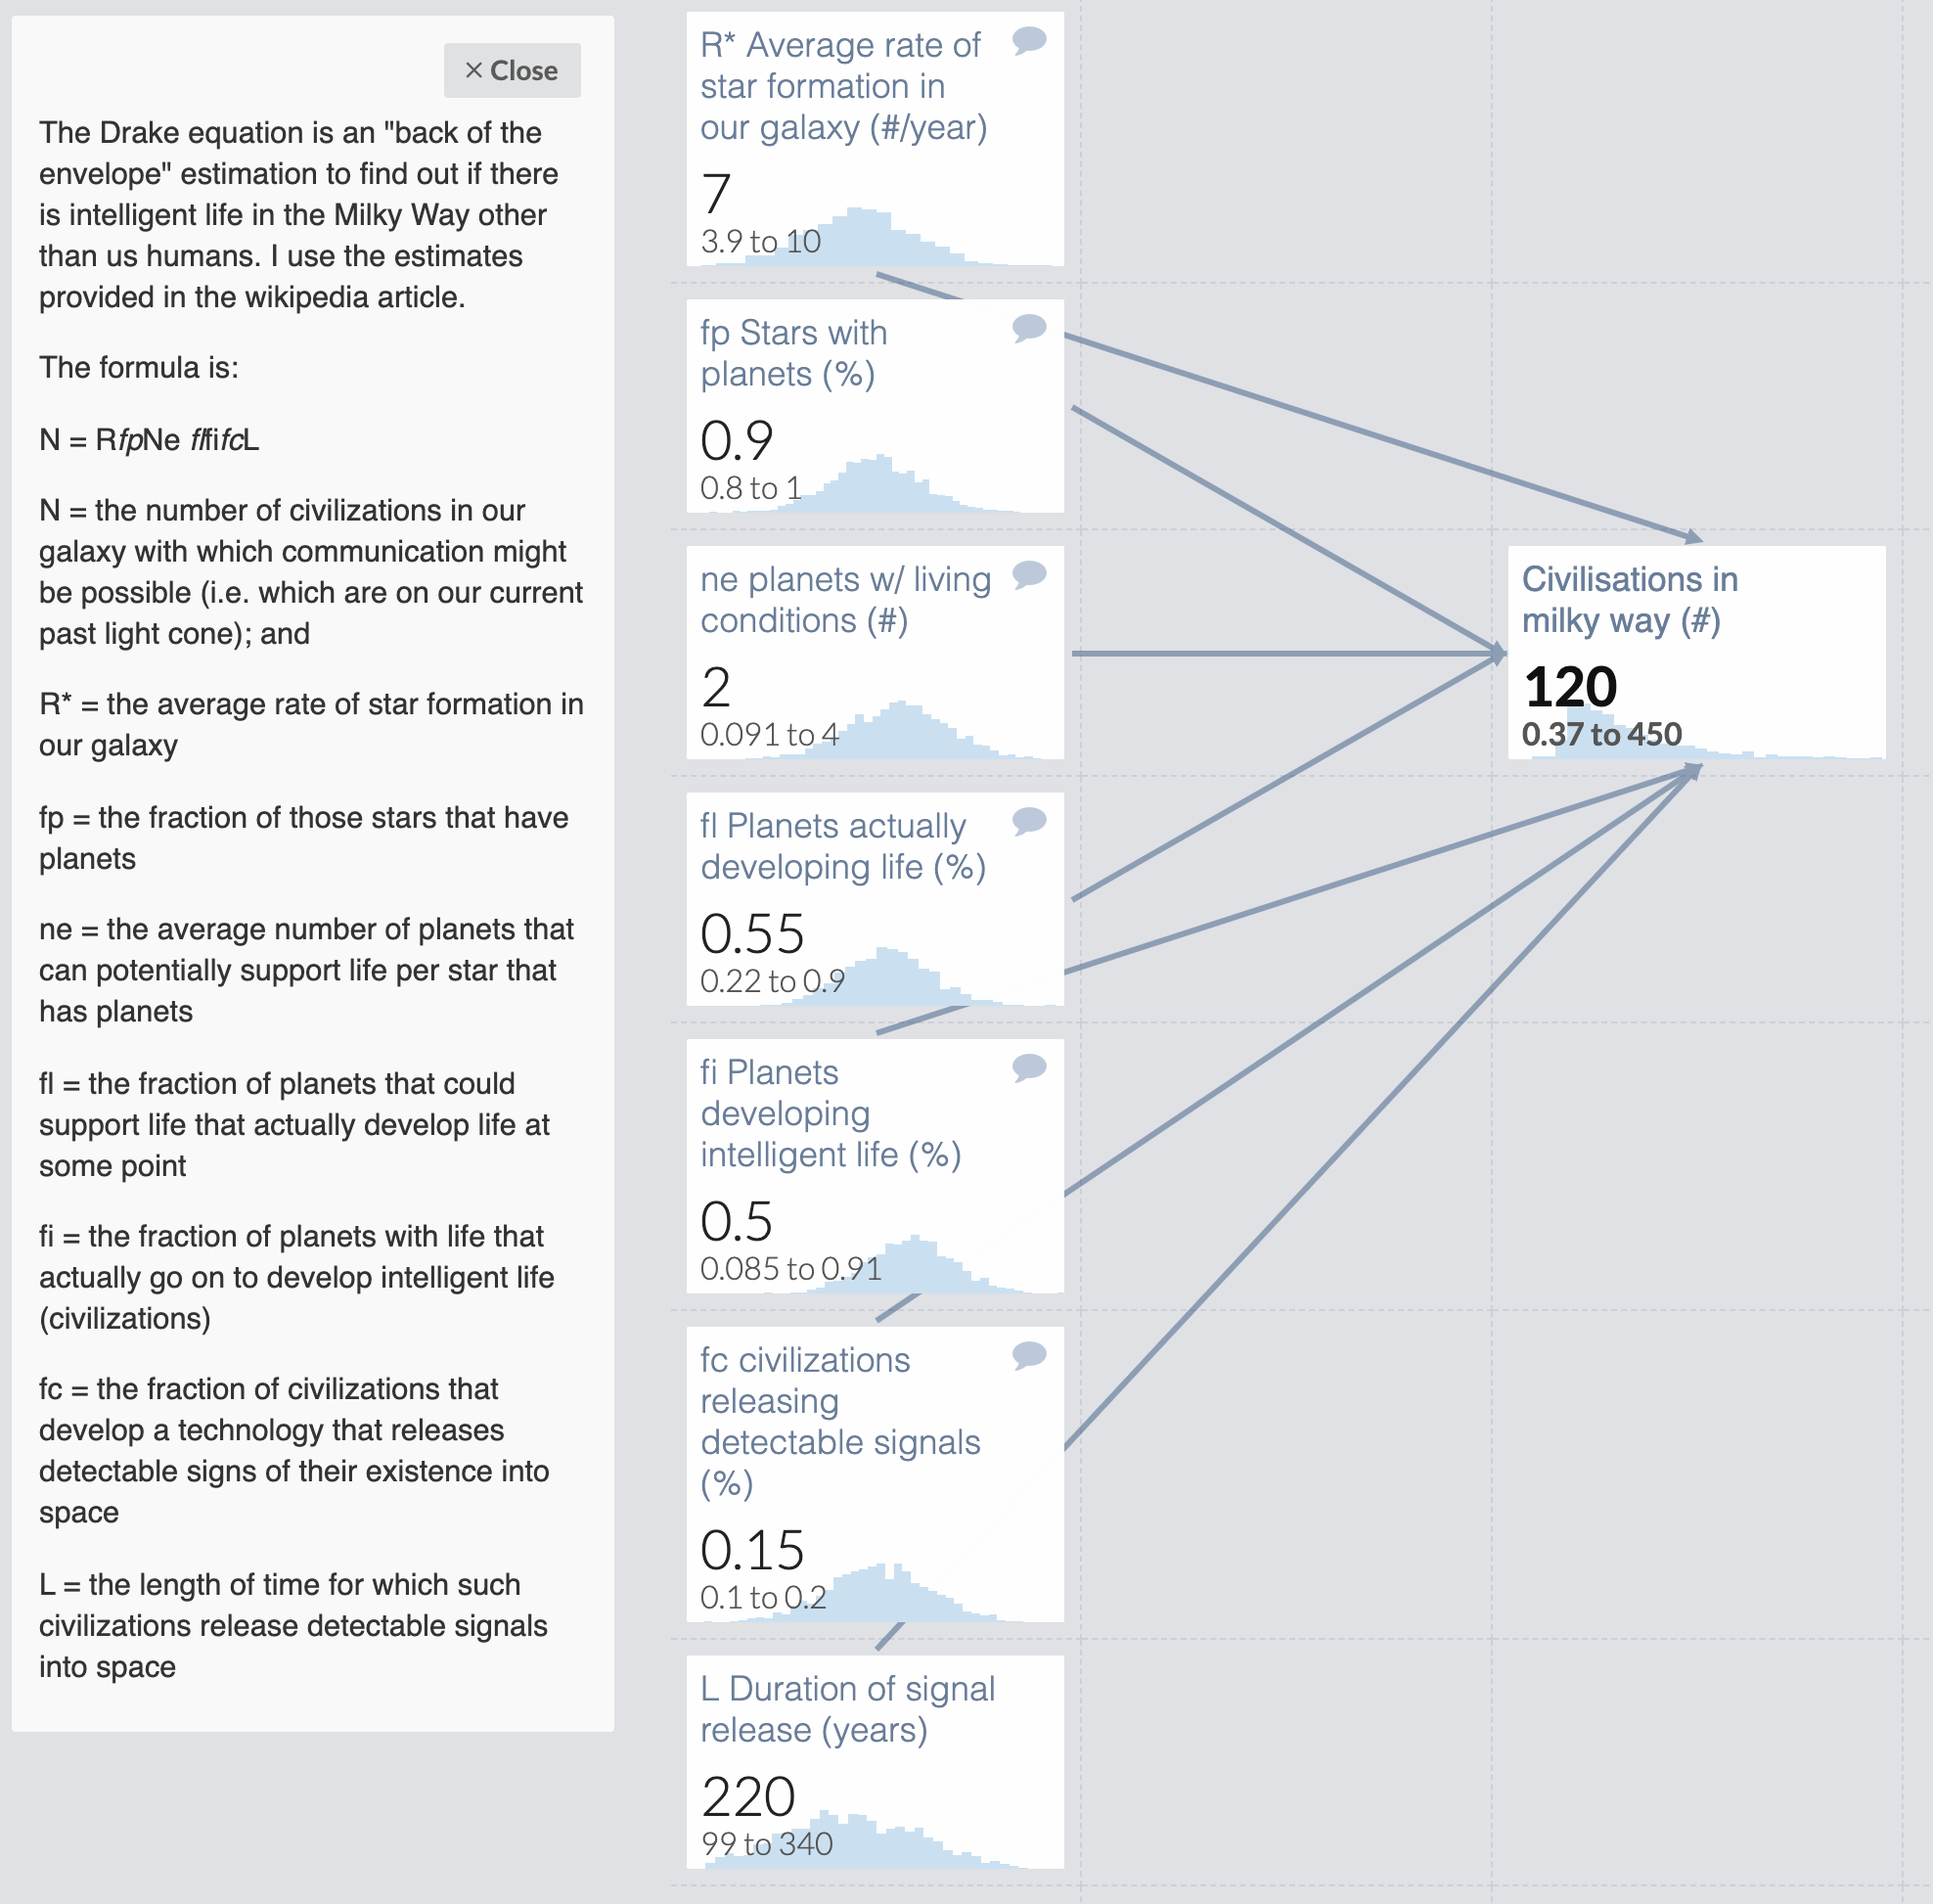
In another example, someone has modelled the Drake equation: “a probabilistic argument used to estimate the number of active, communicative extraterrestrial civilizations in the Milky Way galaxy.”
You can go a bit nuts, too.
So what else, in the real world, might you apply this to?
I’ve looked at:
- Projected return on investment for my ISA
- Possible outcomes for a team with aggressive targets and high uncertainty of success
- Expected costs of people attempting to defraud Bulb members in a given quarter
- Anticipated queries-per-second to Twitter’s GraphQL Service
- Potential ranges of costs to remodel a house
In particular, modelling the potential outcomes for my team at work gave us a really strong understanding of what we could expect to achieve in the quarter and, more importantly, what we should not expect.
It’s pretty cool.
From here you can:
- Read up on the theory behind Guesstimate
- Learn how to model
- Get fancy with their wide array of distribution functions
Enjoy!